Measurement · Explainer
Google says 340 conversions. Meta says 280. You had 400 orders. Nobody is lying, everybody is wrong, and the fix isn’t a better model.
The moment that radicalises most marketers on this subject is the same one. You open three dashboards to build a monthly report, add up the conversions each platform claims, and the total exceeds the number of orders in your actual database by something like forty percent. Then you spend two days trying to find the tracking bug, and there isn’t one.
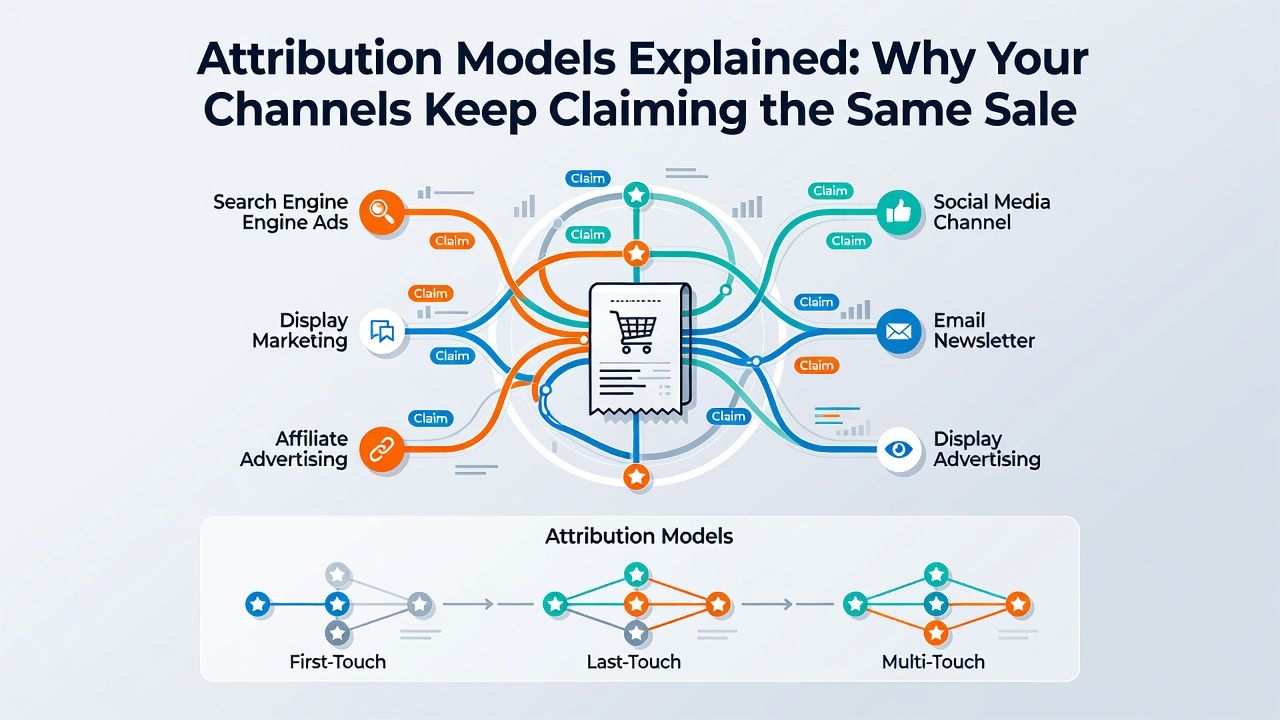
There’s no bug because each platform is answering a different question, using its own data, with its own rules, and none of them has been asked to be consistent with the others. Google Ads reports conversions it believes its clicks caused. Meta reports conversions it believes its impressions and clicks caused. Neither knows the other exists. If a customer saw a Facebook ad on Tuesday, searched your brand on Thursday and bought, both platforms count that sale in full. They are each correct within their own frame, and the frames overlap.
Understanding attribution properly means accepting something faintly disappointing up front: attribution is not measurement. It’s an allocation convention. It takes a number you know — total conversions — and divides it among touchpoints according to a rule someone chose. The rule is not discovered from data. It’s imposed on it.
The Models, Briefly and Honestly What each one is actually biased toward
Every attribution model is a sentence about which touchpoint deserves credit. Here’s what each one is really saying, including the bias it builds in.
Last click. All credit to the final touchpoint before conversion. Says: only the closing action matters. Systematically overvalues branded search and retargeting, because those are the last thing people do before buying, and systematically undervalues everything that created the demand in the first place. It’s the default in most places for one reason: it’s unambiguous. Nobody argues about which touchpoint was last.
First click. All credit to the first touchpoint. Says: only discovery matters. Overvalues top-of-funnel display and social; undervalues the channels that actually close. Useful precisely as a counterweight — run your numbers under both first and last click and the gap between them tells you which channels are opening and which are closing.
Linear. Equal credit to every touchpoint. Says: we have no idea, so let’s be fair. Its virtue is that it has no built-in agenda, which makes it a reasonable neutral baseline. Its vice is that it treats a fleeting display impression as equal to a forty-minute comparison session.
Time decay. Credit weighted toward touchpoints nearer the conversion, typically on a seven-day half-life. Says: recency correlates with influence. Sensible for short consideration cycles, actively misleading for long ones — a three-month B2B sale gets almost all its credit assigned to the final fortnight.
Position-based. Usually 40% to the first touch, 40% to the last, 20% split among the middle. Says: discovery and closing matter most. Arbitrary in a way that’s at least openly arbitrary, and often the most intuitively satisfying model for people who have to explain it to a board.
Data-driven. Credit assigned by a model trained on your own conversion paths, comparing paths that converted against paths that didn’t. Google’s implementation draws on Shapley-value logic from cooperative game theory. Says: let the data decide. Better than the rules-based models in principle, and dependent on conversion volume — below a few hundred conversions a month it has too little signal to learn from and produces results that look precise while being noisy.
What Google Just Did to Your Options Mid-2026 · Not optional
If you’re reading older guides, several models described above are no longer available in Google’s ecosystem.
GA4 dropped first-click, linear, time-decay and position-based during 2023. Three models remain: data-driven attribution as the property default, paid and organic last click, and Google paid channels last click.
The same removal has now completed in Google Ads. From mid-July 2026, those four models stopped being selectable for any new conversion action. By September 2026, conversion actions still running one of them are migrated to data-driven attribution automatically — no opt-out, no action required, on Google’s timeline rather than yours.
The practical warning: if your reports look different this autumn and you changed nothing, this is why. A conversion action moving from last-click to data-driven will shift credit between campaigns, which shifts your reported CPA by campaign, which — if you have automated rules or a bidding strategy keyed to CPA targets — changes what your account does with money. Check which of your conversion actions are affected before September, not after.
Google’s stated reasoning is that rules-based models are outdated and data-driven is more accurate. That’s partly true and partly convenient: data-driven attribution is a black box that only Google can compute, which makes independent verification of Google’s own performance considerably harder.
“Attribution is not measurement. It is an allocation convention — a rule someone chose, imposed on a number you already knew.”
Why Your Platforms Disagree, Specifically Four mechanical reasons
Beyond model choice, four structural differences guarantee your dashboards never reconcile.
Different attribution windows. Meta’s default has long been 7-day click and 1-day view. Google Ads defaults run considerably longer, with conversion windows commonly set at 30 days and lookback windows up to 90. A conversion 20 days after a Meta click falls outside Meta’s window and inside Google’s. Same sale, different verdicts, purely because of a dropdown neither of you set.
View-through conversions. Meta counts conversions from people who saw an ad without clicking. Google Search doesn’t, because there’s no impression to count in the same sense. This single difference accounts for a large share of the overlap in most accounts, and it’s the first thing to strip out when you’re trying to reconcile numbers.
Different identity resolution. Meta matches logged-in users across devices with high confidence. Google matches signed-in Google users. GA4 without user IDs matches cookies on a single browser. Three sets of books on who the customer even is.
Reporting date conventions. Ad platforms typically report conversions on the date of the click. Analytics tools report them on the date of the conversion. A sale on the 3rd from a click on the 28th appears in different months depending on where you look. This is the sneakiest one, because it makes monthly reports disagree even when everything else is configured identically.
The Part Most Attribution Articles Won’t Say Correlation, not causation
Every model described above shares one deep flaw, and it isn’t fixable by choosing a better model.
All click-based attribution measures correlation between touchpoint and conversion. What you actually want to know is whether the touchpoint caused the conversion — whether the sale would have happened anyway without it. Those are different questions, and the gap between them is not small.
Branded search is the clearest case. Someone who already decided to buy from you types your brand name, clicks your ad, and buys. Attribution credits the branded search campaign with the sale. Turn that campaign off and most of those people click your organic listing and buy anyway. The campaign was credited with revenue it did not create. Every marketer who has run this test knows the feeling of watching branded search spend produce far less incremental revenue than the dashboard promised.
The published research on this is not encouraging for anyone who wants attribution to be a solved problem. Work published in IEEE Access in 2026 by researchers at Dropbox compared click-based attribution — data-driven attribution included — against geo-based incrementality experiments, and found click attribution overstating causal impact by a factor of two to ten. Avinash Kaushik, formerly Google’s own digital marketing evangelist, has described multi-touch attribution as the “smart” rung of measurement and incrementality as the “super smart” one. Data-driven attribution doesn’t get you to the top rung; it gets you off the bottom.
The category is shifting accordingly. At least one established attribution vendor, HockeyStack, publicly exited the space in early 2026 on the grounds that a single hidden model wasn’t a defensible product. That’s a striking thing for a company to say about its own market.
A Worked Example, Because Abstraction Doesn’t Land One customer, six verdicts
A customer’s actual path to a £180 purchase, which is a perfectly ordinary one:
Day 1, sees an Instagram ad, doesn’t click. Day 3, clicks a Facebook ad, browses, leaves. Day 8, reads a comparison article that a friend sent, clicks through, leaves. Day 12, searches a generic category term, clicks a Google Shopping ad, adds to basket, abandons. Day 14, receives an abandoned-cart email, clicks, buys.
Now the verdicts. Last click gives the entire £180 to email. First click gives it to paid social. Linear splits it roughly £45 each across the four clicked touchpoints. Time decay weights it heavily toward Shopping and email. Position-based gives £72 to paid social, £72 to email, £36 to the middle. Data-driven gives some idiosyncratic split derived from all your other paths.
Meanwhile, in the platforms: Meta claims the sale, counting both the day-1 view and the day-3 click. Google Ads claims the sale from the day-12 Shopping click. Your email platform claims it. Three systems, three full claims, £540 of reported revenue on a £180 order.
And the referral article on day 8 — arguably the touchpoint that did the persuading — appears in exactly one of these accounts, as an unpaid channel nobody is optimising.
That’s the whole problem in one example. No model above is wrong. Each is a different defensible answer to “who gets the credit,” and the only genuinely wrong move is treating any of them as a measurement of what caused the sale.
The Windows You Should Set Deliberately Defaults chosen by someone else
Attribution windows are the least-examined settings in most accounts, and they change your numbers more than the model does.
In GA4, the default lookback is 90 days for most key events and 30 days for acquisition events like first_open and first_visit. YouTube engaged-view attribution runs on a fixed three-day window that can’t be changed. Critically, window changes are not retroactive — historical data doesn’t reprocess, so extending a window shows its full effect only gradually, over the length of the new window.
The principle for setting them: your window should reflect your actual consideration cycle. A £15 impulse purchase does not need a 90-day window, and giving it one credits touchpoints from three months ago that had nothing to do with the sale. A £15,000 B2B contract with a four-month cycle is badly served by a 30-day window that discards the entire top of the funnel.
Find your real cycle from your own data — time from first session to purchase, at the median and the 90th percentile — and set the window to cover the 90th percentile. Then leave it alone, because every change breaks comparability with everything before it.
What to Do Instead Three methods, in ascending order of effort
Holdout and geo tests
Turn a channel off in some geographies and leave it on in others, then compare total revenue — not attributed revenue, total. This is the closest thing to a genuine experiment available to most marketers, it requires no special tooling, and it answers the only question that matters: what happens to the business when we stop spending here?
It costs you something. Turning off a working channel in a region for four weeks is real lost revenue if the channel works. But if it doesn’t work, you’ve been losing that money continuously and silently. I’ve watched a single four-week geo holdout on a retargeting campaign save more budget than a year of dashboard optimisation.
Marketing mix modelling
Regression against aggregate spend and outcomes over time, ignoring individual user paths entirely. Written off as a relic of television-era advertising for years, and now back, precisely because it needs no user-level tracking and is therefore immune to cookie loss, consent rates and browser privacy changes. Open-source implementations exist — Google’s Meridian and Meta’s Robyn are both free — and they want two to three years of weekly data plus meaningful variation in spend to work. If your budget has been flat for two years, MMM has nothing to learn from.
Post-purchase surveys
The unglamorous one that works better than it should. One field on the order confirmation: “How did you hear about us?” Self-reported, biased, noisy — and it consistently surfaces channels that no tracking system sees at all. Podcasts, word of mouth, a mention in a newsletter, someone’s colleague. In several accounts I’ve worked on, the survey data and the attribution data disagreed sharply, and the survey was closer to the truth about what was growing the business.
A Sane Measurement Stack, By Size
| Business stage | Primary method | Use platform data for | Effort |
|---|---|---|---|
| Under ~$10k/mo ad spend | Last-click plus a post-purchase survey | Deciding between campaigns inside one platform | Low |
| $10k–$50k/mo | Add quarterly geo holdout tests on your largest channel | Day-to-day optimisation only | Medium |
| $50k–$250k/mo | Regular incrementality testing; BigQuery for path analysis | Bidding signal, not budget allocation | High |
| Above ~$250k/mo | Marketing mix modelling plus a continuous testing programme | Tactical execution within an agreed budget | Very high |
Notice what happens as you move down that table: platform-reported attribution is progressively demoted from “the answer” to “an operational signal.” That’s the trajectory. The sophisticated end of the market has largely stopped asking dashboards how much revenue a channel produced, because they’ve established that dashboards don’t know.
How to Actually Present This to a Boss
The conversation that ruins attribution projects is the one where you explain that the numbers are unknowable and someone senior hears “you don’t know what you’re doing.”
What works better, in my experience, is framing it as three separate reports rather than one contested one. Report one: total revenue, from the order database, with no attribution at all — this is what the business did. Report two: channel-level directional performance, clearly labelled as platform-reported and clearly noted as double-counting. Report three: results of whatever test you last ran, stated as a causal claim, because it is one.
That structure survives contact with a CFO in a way that a single blended dashboard never does, because it separates the number that is definitely true from the numbers that are useful-but-arguable. It also, quietly, moves the organisation toward funding tests, which is the actual goal.
Google Ads and GA4 attribution model changes verified August 2026 against Google’s published announcements and current documentation. Research findings on attribution versus incrementality are cited from published academic and industry sources. This article contains no affiliate links.