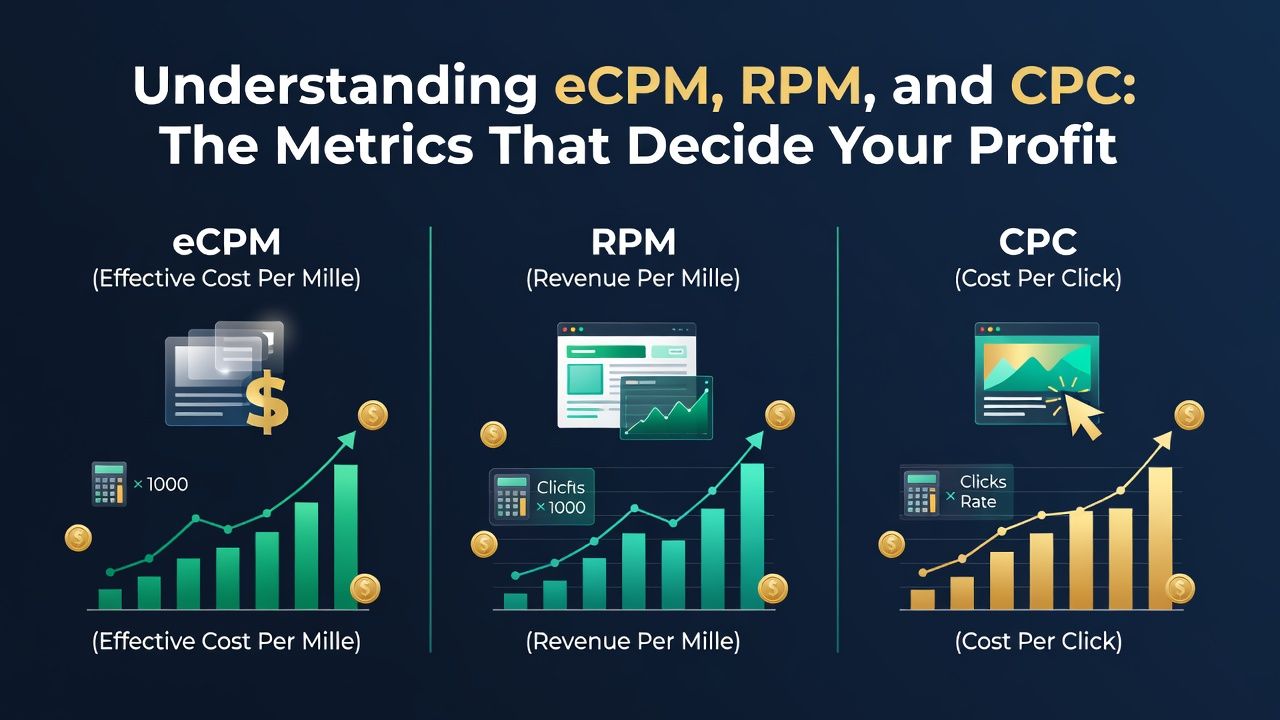
Monetisation · Explainer
Three acronyms, two sides of the same transaction, and one arithmetic relationship that determines whether a business makes money or quietly bleeds it. Most people never learn which number they’re actually looking at.
The confusing thing about advertising metrics is that the same event has different names depending on which end of it you’re standing. One ad, shown once, to one person. To the advertiser it’s an impression they bought at a CPM. To the publisher it’s an impression they sold at an eCPM. To the network in the middle it’s a margin. Everyone is describing the same rectangle of pixels and everyone calls it something else.
Get the vocabulary wrong and you make expensive mistakes — comparing your page RPM against someone else’s eCPM and concluding you’re underperforming when you’re not, or budgeting against a CPC that describes a different traffic mix entirely. So this is a plain-language walk through all three, with the arithmetic written out, and then the part that actually matters: how they combine into the equation that decides profitability.
The Three Metrics, Defined Properly With the formulas
CPC — Cost Per Click
What an advertiser pays each time somebody clicks. Simple, and universally understood because it’s the number in the advertiser’s invoice.
CPC = total spend ÷ total clicks
The thing to understand about CPC is that it’s an outcome, not a price. In an auction system you set a maximum bid, and what you actually pay is determined by the competition and by quality factors. Two advertisers bidding identically on the same keyword can pay materially different amounts per click because one has a better ad and a more relevant landing page.
CPM and eCPM — Cost, and Effective Cost, Per Mille
Mille is Latin for thousand, which is why the abbreviation looks wrong. CPM is the price for a thousand impressions.
CPM = (cost ÷ impressions) × 1,000
eCPM is the same arithmetic run backwards, from the publisher’s side, on revenue that may not have been earned on a CPM basis at all. It’s the great normaliser: it lets you compare a CPC deal, a CPM deal and a revenue-share deal on one scale.
eCPM = (revenue ÷ impressions) × 1,000
Worked through: you serve 40,000 impressions and earn $92. Your eCPM is (92 ÷ 40,000) × 1,000 = $2.30. It doesn’t matter whether that $92 came from clicks, from a fixed CPM buy, or from a mix — eCPM expresses it in one comparable unit.
RPM — Revenue Per Mille
Here’s where the confusion lives. RPM is usually calculated per thousand pageviews or sessions, not per thousand impressions.
Page RPM = (revenue ÷ pageviews) × 1,000
That single difference makes eCPM and RPM non-comparable, and the gap between them is entirely determined by how many ad units you have on a page.
Consider a page with four ad units at a $2.00 eCPM. One pageview generates four impressions. Revenue per pageview is $0.008, so page RPM is $8.00 — four times the eCPM. Now consider a page with one ad unit at a $6.00 eCPM. Revenue per pageview is $0.006, giving an RPM of $6.00, despite the far better eCPM.
The second page sells its inventory three times more effectively and earns less per visitor. Which of those numbers you quote determines the story you tell, and both are true.
Session RPM: The Only Number That Doesn’t Lie Publisher’s north star
For anyone monetising content, the metric I’d elevate above all others is session RPM — revenue per thousand visits, rather than per thousand pageviews.
Session RPM = (revenue ÷ sessions) × 1,000
Why it matters: page RPM can be gamed and session RPM cannot. Split an article across five pages and your pageviews multiply while your page RPM plummets, even though total revenue may rise. Add three more ad units and page RPM climbs while user experience degrades and returning visitors quietly stop returning. Session RPM captures the whole visit — how many pages they read, how many ads they saw, what those ads earned — in one figure that maps directly onto the question you actually care about: what is a visitor worth?
And that question is the hinge on which any traffic-buying business turns.
The Arbitrage Equation Where the profit actually is
If you buy traffic and monetise it with advertising, your entire business is one inequality:
“Revenue per visitor must exceed cost per visitor. Everything else is detail.”
Written properly: (session RPM ÷ 1,000) > CPC, assuming one click bought equals one session.
Worked: you buy clicks at $0.05. Your session RPM is $80, so each visitor generates $0.08. Margin is $0.03 per visitor, or 37.5%. Scale that and it’s a business.
Now change one variable. The advertiser mix on your pages shifts and session RPM falls to $45. Revenue per visitor is now $0.045, against a cost of $0.05. You are losing half a cent per visitor, at whatever volume you’re running, and nothing about the operation looks different from the outside. This is why anyone in this business watches RPM daily rather than monthly — the gap between profitable and unprofitable is often smaller than a single week’s variance.
Three things reliably compress that margin, and all three are outside your control:
Seasonality. Advertiser budgets follow calendar quarters. Q4 is the peak, with November and December frequently 30–50% above annual average as retail budgets flood the market. January is the cliff — budgets reset, spending pauses, and RPMs can fall by a third or more within days. Anyone who scales a traffic-buying operation on December economics discovers this in the first week of January. Judge performance year-on-year, never month-on-month.
Traffic composition. Geography and device shift eCPM more than almost anything. The same content earns multiples more from tier-one English-speaking desktop traffic than from mobile traffic in low-CPM markets. An aggregate RPM figure across mixed traffic is an average of two very different businesses, and it will hide the fact that one segment is subsidising a loss on another.
Format and policy changes. Platforms change what they offer, and revenue moves without any action on your part. Publishers who built RPM assumptions around a particular ad format have repeatedly learned that the format can be removed or restructured at the platform’s convenience, with weeks of notice. Build your model with headroom.
Fill Rate and Viewability: The Multipliers The two numbers behind eCPM
Fill rate is the percentage of ad requests that return an actual ad. Fill rate = (impressions served ÷ ad requests) × 100.
An unfilled request earns nothing, so eCPM calculated on requests rather than served impressions can look very different. Low fill usually means your inventory isn’t attracting bids — geography, content category, poor viewability history, or traffic quality flags. Chasing fill by accepting any bid at any price is a trap, though: a 100% fill rate at $0.30 eCPM is worse than 70% fill at $2.00.
Viewability is the percentage of served impressions that actually entered the user’s view long enough to count — the standard threshold being 50% of pixels for at least one second for display. This has become one of the largest determinants of what buyers will pay. An ad unit far below the fold might serve reliably and be worth a fraction of an above-the-fold unit, because sophisticated buyers filter on viewability before bidding.
Which produces a genuinely counterintuitive result: removing a badly-placed ad unit can increase total revenue. Fewer impressions, but a higher site-wide viewability score, better buyer perception of the inventory, and higher bids across every remaining unit. I’ve seen a publisher remove two low-viewability units and gain revenue within a month. Ad density has a peak, and most sites that chase page RPM are past it.
The Metrics Compared
| Metric | Formula | Whose number | What it actually tells you |
|---|---|---|---|
| CPC | spend ÷ clicks | Advertiser | What attention costs to buy |
| CPM | (cost ÷ impressions) × 1,000 | Advertiser | What exposure costs to buy |
| eCPM | (revenue ÷ impressions) × 1,000 | Publisher | How well one ad slot monetises |
| Page RPM | (revenue ÷ pageviews) × 1,000 | Publisher | Slot value × ad density combined |
| Session RPM | (revenue ÷ sessions) × 1,000 | Publisher | What a visitor is genuinely worth |
| Fill rate | (served ÷ requested) × 100 | Publisher | Whether anyone wants your inventory |
| Viewability | (viewable ÷ served) × 100 | Both | Whether the impression was real attention |
| CTR | (clicks ÷ impressions) × 100 | Both | Relevance, on either side of the trade |
Reading the Same Numbers From the Buy Side Where advertisers get caught
Everything above was written from the publisher’s chair. Turn it around and the same arithmetic produces a different set of traps.
An advertiser buying on CPM is exposed to whatever the publisher’s viewability and traffic quality actually are, and pays regardless. An advertiser buying on CPC is insulated from unviewable impressions — nobody clicks an ad they never saw — but exposed to click quality instead. Neither model protects you from both. Which risk you’d rather carry should be a deliberate choice, and for most performance advertisers CPC or CPA buying is the safer default precisely because it pushes the delivery risk back onto the seller.
The advertiser’s version of session RPM is cost per acquisition against customer value, and the same discipline applies: segment it. A blended $40 CPA that’s $22 on branded search and $95 on prospecting is two businesses averaged into one number, and the average will tell you the account is healthy right up until you scale the wrong half of it.
The other buy-side trap is treating CPC as a target to minimise. Cheaper clicks are trivially easy to obtain — broaden the targeting, accept lower-quality placements, bid on vaguer terms — and they are frequently worth less than they cost. A $4 click converting at 6% costs $67 per conversion. A $0.60 click converting at 0.4% costs $150. The cheaper traffic is more than twice as expensive where it counts. CPC in isolation is close to meaningless; CPC divided by conversion rate is the number to watch.
Three Worked Scenarios The arithmetic in context
A niche blog. 60,000 monthly sessions, 2.1 pages per session, two ad units per page. Monthly revenue $840. Pageviews are 126,000, impressions 252,000. Page RPM is $6.67, eCPM is $3.33, session RPM is $14. That last figure is the useful one: each visitor is worth 1.4 cents. Any traffic acquisition above that price loses money, which is why organic and email are the only viable channels at this level.
The same blog, restructured. Content shifts toward higher-value commercial topics and one poorly-viewable unit is removed. Sessions fall slightly to 55,000, ad units drop to one and a half per page on average, but eCPM rises to $9.00. Impressions are now roughly 173,000, revenue $1,557. Session RPM is $28.30 — double the previous figure on fewer sessions and fewer ads. This is the pattern that surprises people, and it recurs constantly: value per impression scales further than impression count.
A traffic-buying operation. 500,000 sessions bought at $0.04 per click, costing $20,000. Session RPM of $52 produces $26,000. Margin is $6,000, or 23%. Now a single variable moves: the traffic mix shifts 15% toward a lower-value geography and blended session RPM falls to $43. Revenue is $21,500 against the same $20,000 cost. Margin has collapsed from 23% to 7% with no visible change in the operation, and one more small shift puts it underwater. That fragility is the whole reason segmentation isn’t optional in this business — the blended number gives you no warning at all.
How These Numbers Mislead Four traps worth naming
Averages conceal everything. A blended session RPM of $30 might be $70 from desktop US traffic and $6 from mobile traffic elsewhere. If you’re buying traffic against the blended figure, you’re funding the loss-making half with the profitable half and calling it a business. Segment by country, by device, by traffic source, and by landing page before drawing a single conclusion.
Small samples produce confident nonsense. RPM on a thousand pageviews is noise. One accidental click on a high-value ad can move it several dollars. Judge nothing below roughly 50,000 impressions, and preferably a full week to cover the day-of-week cycle, which is real and substantial — weekday and weekend RPMs routinely differ by double digits.
Reported and paid figures diverge. Networks deduct invalid traffic after the fact, and your dashboard number on the 3rd of the month is not necessarily the number that arrives in your bank. Reconcile against actual payments quarterly, and if the gap is widening, that’s a traffic quality signal worth investigating before it becomes an account problem.
Rising RPM isn’t always good news. If RPM rose 20% while pageviews fell 30%, revenue fell. RPM is a ratio, and ratios improve when the denominator collapses. Always read it alongside volume, never alone.
What Actually Raises RPM In order of effect
Change who visits. Nothing else comes close. The gap between traffic from a high-value market on desktop and traffic from a low-value market on mobile is larger than any optimisation you can perform on the page. If you can shift your content mix or acquisition toward higher-value geographies and higher-intent queries, do that first — the ceiling on everything else is set by who’s arriving.
Change what they’re reading about. Advertiser demand varies wildly by topic. Finance, insurance, legal and B2B software command multiples of what entertainment or general news does, because the underlying customer is worth more. A single well-targeted commercial article can out-earn twenty general-interest ones.
Increase competition for your inventory. More bidders means higher clearing prices. This is the entire mechanical argument for header bidding and for working with multiple demand sources rather than one. It’s also the argument for the ad management partners that sit between small publishers and the exchanges — they aggregate demand you couldn’t access alone, and take a cut for it.
Improve viewability before adding density. Move units into view, use sticky formats carefully, lazy-load below-the-fold slots properly so they request only when approaching the viewport. Higher viewability raises the price of every impression rather than just adding more cheap ones.
Then, cautiously, consider layout. More units raises page RPM and degrades experience, page speed and Core Web Vitals, all of which cost you traffic over time. The revenue is immediate and visible; the cost is delayed and invisible. That asymmetry is why so many sites end up unreadable.
Formulas and definitions follow standard industry usage; viewability thresholds reflect the widely-adopted Media Rating Council standard. Seasonality figures are directional based on common publisher experience rather than a single published dataset. This article contains no affiliate links.